
Everything you need to know about methods of inventory control. Inventory valuation affects the profitability, the business unit must take enough care to ascertain the correct value of inventory.
To ensure this, the method of valuing the inventory should not be changed from year to year. Inventory includes stock of raw materials, work-in-progress, finished products and stores and spares.
Inventory control means regulating inventories by accounting and physical methods.
Also known as stock control, inventory control is, according to the definition given by the Official Terminology, “The systematic regulation of stock levels.” It is, in other words, a system aimed at controlling investment in inventory. It involves inventory planning and decision-making with regard to the quantity and time of purchase, fixation of stock levels, maintenance of stores records and continuous stock-taking.
ADVERTISEMENTS:
The methods of inventory control are as follows:-
1. First-in-First-out (FIFO) Method 2. Last in First Out (LIFO) Method 3. Highest-in-First-out (HIFO) Method 4. Base Stock Method 5. Inflated Price Method 6. Standard Price Method 7. Market or Replacement Price Method
8. Average Cost Method 9. Determination of Reorder Quantity 10. Fixation of Stock Levels 11. ABC Analysis 12. Two Bin System 13. Perpetual Inventory System 14. FNSD Analysis and a Few Others.
Methods and Techniques of Inventory Control: FIFO, LIFO, HIFO, Base Stock Method and a Few Other Methods
Methods of Inventory Control – 8 Important Methods: First in First Out (FIFO) Method, Last in First Out (LIFO) Method, Highest-in-First-out (HIFO) Method and a Few Others
Inventory valuation affects the profitability, the business unit must take enough care to ascertain the correct value of inventory. To ensure this, the method of valuing the inventory should not be changed from year to year.
ADVERTISEMENTS:
The cost of inventories is assigned by using any of the following methods:
1. First in First Out (FIFO) Method.
2. Last in First Out (LIFO) Method.
3. Highest-in-First-out (HIFO) Method.
ADVERTISEMENTS:
4. Base stock Method.
5. Inflated Price Method.
6. Standard Price Method.
7. Market or Replacement Price Method.
ADVERTISEMENTS:
8. Average Cost Method.
Method # 1. First-in-First-out (FIFO):
This method follows the principle that goods received first are sold first. In other words, the earliest lot of materials are exhausted first on the assumption that units are sold in the order in which they were acquired. After the first batch of goods purchased is exhausted, the next lot is taken up for sale. The inventory is priced at latest stock.
Method # 2. Last-in-First-out (LIFO):
This method is based on the principle that materials entering production are the most recently purchased. In other words, those materials which are purchased at the end are used for production. The objective of this method is that the matching of current cost against current revenues, resulting in an operating income which excludes gain and loss from holding of inventories.
Method # 3. Highest-in-First-out (HIFO):
This method is based on the assumption that closing stock should always remain at the minimum value, so materials with higher value are issued first and get exhausted at the earliest. But this method is not popular as it always undervalues the stock which amounts to creating secret reserves. This method may be used in case of cost plus contracts or monopoly products.
Method # 4. Base Stock:
ADVERTISEMENTS:
Under this method, a minimum fixed stock of material is always maintained as base stock to meet emergency requirements when there is a delay in supply of raw materials. This is also called safety stock. Any quantity over and above the base stock is issued for production. This method is used in conjunction with either FIFO or LIFO method and base stock method will have the advantages and disadvantages of the method with which it is used.
The objective of base stock method is to issue the materials at current prices which can be achieved if it is used with LIFO method, though it can be also used with FIFO method.
Method # 5. Inflated Price:
This method is adopted for pricing the issues which are subject to normal wastage due to reasons like evaporation, shrinkage, climatic conditions etc. This method provides an accurate matching of costs and revenues because purchases prices are identified with sales prices. But the drawback of this method is that it is not valued at the current prices and is impractical where inventory units lose their identity. Again this method does not prescribe any particular order in which materials are to be issued.
Method # 6. Standard Price:
Under this method, issues are priced at a determined price irrespective of the price at which materials are purchased. The standard price is determined after considering all the factors affecting the price of material such as market conditions, quantity to be purchased, insurance, storage expenses, chances of rise in prices etc.
ADVERTISEMENTS:
The merits of this method is that it is easy to work and it works as a tool for measuring the purchase efficiency. But on the other hand it also suffers from draw backs. The issues are not valued at cost prices and it cannot be used for long period.
Method # 7. Market or Replacement Price:
The materials are issued to production are priced at the market price or replacement price. This method is followed when the market value is lower than the cost so that possible losses may be provided for. Again this method is useful in case the material has become obsolete or lying in the store for a long period.
Method # 8. Average Cost:
Under this method, the average price of the unit is calculated. This average price of unit can be calculated either by simple average price method or by weighed price method. Simple average price is the average of prices without having any regard to the quantities involved.
Under weighted average, the total quantity and total cost is considered in computing the average price. The quantity bought is added to the stock in hand and new revised balance is then divided by the new total value of the total stock. The weighted average is calculated each time a purchase is made.
Methods of Inventory Control – 7 Major Methods: Determination of Reorder Quantity, Fixation of Stock Levels, ABC Analysis, Two Bin System and a Few Others
Inventory includes stock of raw materials, work-in-progress, finished products and stores and spares. Inventory control means regulating inventories by accounting and physical methods.
For effective and efficient control of inventory, the following methods are employed:
1. Determination of reorder quantity or economic order quantity;
2. Fixation of stock levels – reorder level, maximum level, minimum level, safety stock, danger level, average stock;
3. ABC analysis;
4. Two bin system;
5. Perpetual inventory system;
6. Periodic Inventory System, and
7. Physical verification of inventory.
The above methods of inventory control help in achieving the objectives of inventory control, i.e., maximum efficiency in production and sales with minimum investment in inventory.
These methods are discussed briefly one by one below:
1. Determination of Reorder Quantity:
Reorder quantity (also called order quantity) refers to the quantity for which an order is to be placed at any one point of time. Determination of reorder quantity (how much to order) is of great significance since it directly affects inventory costs. Reorder quantity should be such that it minimises the combined annual costs of placing an order and holding stock.
Such reorder quantity that minimises both ordering and carrying costs together is also known as economic order quantity (EOQ). Ordering costs and carrying costs are inversely related, when one increases the other decreases. For example, if purchases are made in large quantities, inventory carrying costs will be high. If order size is small, ordering costs will be large. Economic order quantity ensures that these two costs are minimum.
Economic order quantity can be determined in the following two ways:
(a) EOQ Formula Method:
This method is generally adopted when purchase price remains the same irrespective of the order quantity. In other words, when the vendor does not extend any quantity discount. In this case, EOQ formula minimises the total cost of inventory consisting of – (i) cost of placing orders and receiving the goods (ordering cost); and (ii) cost of storing the goods as well as the interest on the capital (carrying cost). These costs are inversely related, when one increases the other decreases. In case of large orders, carrying costs will be high and order cost will be low. But the reverse will be the case if orders are too many but of small size.
The formula for determining the economic order quantity is:
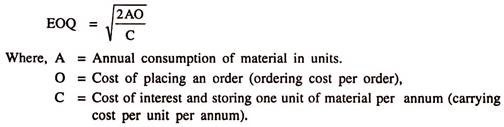
The EOQ formula gives the optimum quantity for which an order should be placed at one point of time. It may be noted that the formula holds good only when purchase prices are not likely to change, consumption is regular and stock holding and ordering costs are constant.
(b) Tabulation Method:
This method may be used when the purchase price varies with the quantity of material purchased. In this method we calculate the total material cost per annum including cost of purchases plus cost of ordering plus the carrying cost for different order quantities at various purchase prices.
2. Fixation of Stock Levels:
Carrying too much or too little stock is disadvantageous for a firm. If stock is too little, the firm will have to face frequent stock-outs and incur heavy ordering cost. If stock is very large, the firm will incur heavy carrying cost in addition to unnecessary blocking up of scarce capital. An efficient material control system, therefore, requires the firm to maintain stocks at an optimum level.
At this level inventory costs are minimum and at the same time, there is no stock-out, which may result in stoppage of production. This necessitates the determination of the reorder level, maximum level, minimum level, safety stock, danger level and average stock. It is also possible to calculate reorder quantity by using stock levels.
(a) Reorder Level:
This is the level or the point at which it becomes essential to initiate purchase orders for the fresh supplies of stock items. Whenever an item of stock touches the reorder level, the purchase procedure is automatically activated so that fresh stock can be procured in time. Normally, reorder level is a point between the maximum and minimum levels.
Fresh orders must be placed before the actual stock touches the minimum level, so as to take care of gap in time between the placing of on order and receipt of goods. Reorder level also covers emergencies such as abnormal usage of the materials or an unexpected delay in procurement of fresh supplies.
The reorder level is generally calculated by one of the following formulae:
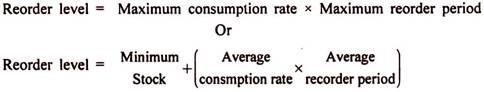
The reorder level is noted on the relevant stores ledger account or the bin card. As soon as the stock approaches the reorder level, the stores ledger clerk or the storekeeper will inform the purchase department by filling up a purchase requisition slip. After that, the purchase department will take action to purchase and replenish the stock. Reorder level is also called reorder point or ordering level.
(b) Maximum Stock Level:
Material control requires laying down the upper limit of stock, above which the stock should not be allowed to rise. Such a limit is known as ‘maximum level’.
In the determination of the maximum level, following factors are considered:
(i) Reorder level;
(ii) Minimum consumption rate during lead time;
(iii) Minimum lead time or reorder period; and
(iv) Reorder quantity.
Accordingly, maximum stock level is determined by the following formula:
![]()
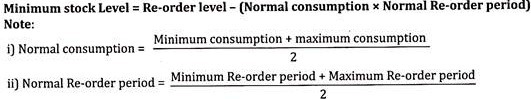
(c) Minimum Stock Level:
This is the level below which stock should not be allowed to fall. Carrying of minimum stock avoids a situation of stock out resulting in the stoppage of production. This stock is a ‘buffer stock’ or ‘safety stock’ to be used only under abnormal conditions or in emergencies and takes care of fluctuations in the lead-time and / or the consumption rate.
In the determination of minimum level, the following are taken into consideration:
(i) Reorder level;
(ii) Average (normal) rate of consumption; and
(iii) Average lead-time.
Thus, minimum level may be determined by the following formula:
![]()
(d) Reorder Period or Lead-Time:
A firm would not be required to maintain any stock if the goods were available instantaneously on demand. Experience has shown, however, that this is not so. The buying firm requires some time to process and place the order. The supplying firm also requires some time to execute the order. This period is called ‘reorder period’ or ‘lead time’. To continue production during this period, it is essential to maintain necessary stock indicating reorder level.
(e) Safety Stock:
For all practical purposes, minimum stock is safety stock and is determined in the way explained above. The safety stock is maintained to take care of fluctuations in the lead-time and consumption rate. In the case of safety stock, major relevant costs are the carrying costs and stock out costs.
The optimum safety stock can also be determined by striking a balance between carrying costs and stock out costs. The optimum safety stock will exist at a level where the annual total stock out costs and carrying costs are minimum.
(f) Danger Level:
It is a signal to the concerned people to arrange for the procurement of materials urgently to avoid stock-out. It may be either between reorder level and minimum level or below minimum level. When danger level is between reorder level and minimum level, the objective is to check whether or not ordered materials will come in time.
For taking special steps to procure materials, the danger level is indicated below the minimum level and may be determined by multiplying average consumption per day with lead-time required to make emergency purchases. For example, if average consumption per day of a material is 10 units and time required to make emergency purchase is 4 days, the danger level will be-
10 units x 4 days = 40 units.
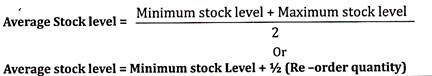
(g) Average Stock Level:
It may be calculated in the following three ways:
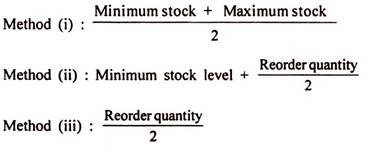
(h) Reorder Quantity:
If data for computation of economic order quantity by EOQ formula are not available, the reorder quantity can be determined by using stock levels as under-
![]()
3. ABC Analysis:
It is an important technique of inventory control on selective basis. Large manufacturing organisations have such a large number of items in their stores that it is often not possible for the management to pay the same attention to each and every stock item. ABC analysis is a technique whereby the extent of control over an item of inventory varies directly with its usage value.
In other words, the high value items are controlled more closely than the items of low value. It would normally be found that a small number of items add up to a very high value. Thus 5 to 10 percent of total items may constitute 70 to 85 per cent of total material cost. Such items are classified as A items.
Another 10 to 20 percent of total items may represent 10 to 20 percent of the total material cost. These items may be categorized as B items. The rest, i.e., 70 to 85 percent of items (though numerous) will form only 5 to 10 per cent of the total material cost. These may be called C items. Management can exercise a very close control over A items. It will determine maximum, minimum, reorder and danger levels of A items very carefully.
A close watch on the consumption of these items will also have to be kept. The economic order quantity for each of the items in this category should be worked out. Similarly, other techniques of inventory control should also be applied to A items. Since A items constitute the bulk of investment in the total inventory, it would be worthwhile to bring them under close control and to apply modern management inventory control techniques.
However, occasional or moderate control over B items may be considered satisfactory and the frequency of purchase and issue of these items may be so planned as to keep them at minimum level. Regarding C items, control may be exercised only in a general manner. For example, order for C items may be placed annually or once in six months or so. It is obvious that since C items do not have a high value, the total investment in such items will not be large.
4. Two Bin System:
A bin is a large box-shaped contain for storage of stores items. It includes drawers or other receptacles, used for storing various kinds of materials or articles. The two-bin system of inventory control is used for stock ordering and stock taking. Under the two-bin system, the bin is divided into two parts, one small and the other big.
The small bin is used for storing minimum level of stores and the big bin is used for storing material above the minimum level. The issue of materials is made from the big bin. When the big bin is emptied, it indicates the time for placing an order and the quantity of material in the small bin services as the minimum quantity of stock or as ‘safety stock’.
5. Perpetual Inventory System:
This is a system of stock control in which continuous record of receipt and issue of material is maintained by the stores department. It shows the physical movement of stocks and their current balance. A programme of continuous stock taking usually supports a perpetual inventory system. Sometimes the two terms are loosely considered synonymous. However, there is a difference between the two.
Perpetual inventory system means the system of records, whereas continuous stock taking means the physical checking of actual stock with the records. Strictly speaking, the perpetual inventory system means maintenance of such records (stock control cards, bin cards and the stores ledger) that will show the receipts, issues and balance of all items in stock at all times.
But to ensure accuracy, the system must be supplemented by a system of continuous stock checking which ensures that physical stock agrees with the book figures. The system is essential for planning production and to see that production is not interrupted due to want of materials and stores.
6. Periodic Inventory System:
In this system, issues of materials are recorded after a periodic interval. It does not coincide with the physical movement of stocks. The physical verification of stock is also carried out on a periodic basis. The value of issue of material is determined at the end of the period on the basis of physical verification. The value of opening stock plus material received less the value of stock in hand is taken as the value of stock issued.
This system does not provide information about quantity and value of stock items on a continuous basis. Therefore, periodic inventory is used for low value items. This system also does not reveal material losses during storage, since material in hand in the beginning of the period plus material purchased during the period less material in hand at the end of the period is taken as material issued.
7. Physical Verification of Inventory:
To ascertain the correctness of the balances of stores shown in bin cards and stores ledger, physical verification of stores is essential. The bin cards and the stores ledger show the ‘should be’ or ‘should have been’ balances. Only physical verification would reveal the actual balances. The physical verification of stores can be continuous or periodic.
Continuous Verification:
In continuous stock verification, stores verification is conducted throughout the year. The continuous physical verification of stores is complementary to the perpetual inventory system. Such a system generally dispenses with the necessity of stock taking at the close of the financial year and ensures much better control on stores.
Any discrepancies, irregularities or shortage brought to notice as a result of stock verification are immediately adjusted and reported to the appropriate authorities for necessary corrective action. The system works as a very good moral check on stores staff and acts as a deterrent to dishonesty. Since the stores-keeping staff does not know in advance which items of stores will be verified on a particular day, this ensures effective inventory control.
Periodic Verification:
Under this system of stock verification, the entire stock is verified at periodic intervals, or at the end of the year before the close of accounting year. This system is complementary to periodic inventory system. The verification of stock at the close of the annual accounting period facilitates valuation of stores for showing in the final accounts. However, it causes stoppage or interruption in production during the days of stock verification.
Therefore, the stock verification should be completed as quickly as possible and if possible it should be arranged in such a manner that the stocktaking coincides with a period of slack business activity to minimize dislocation of regular work. Stock verification may also be done at intervals of less than a year, if so desired. But such a course is expensive since the periodic stock verification system involves stoppage of activities for the period of stock taking.
Moreover, for stock verification no regular or special staff is employed; men from different departments/sections of the organisation are drafted at short notice for assistance. Further, periodic stock verification does not help in controlling the risk of pilferage, loss due to theft etc., since stores keeping staff have advance knowledge when the stock taking will take place. However, periodic verification is necessary for work in progress, consumable stores and unused stores lying in the production department or shops, capital assets, loose tools and spares, etc.
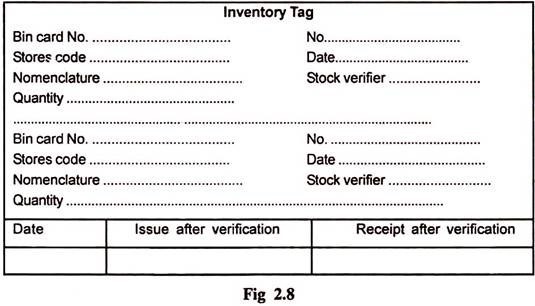
Recording of Stock Verification:
The result of stock verification should be suitably recorded. It may be done by using inventory tags or by preparing stock verification sheets or by making an entry on the bin card itself. The cause for discrepancies between physical quantity and balances shown by bin cards and the stores ledger should be identified.
The discrepancies due to avoidable causes such as wrong entry, wrong issue, wrong posting, wrong placement, pilferage, breakage and wastage, etc., should be rectified by making appropriate adjustment entry in the relevant records and by taking suitable measures to prevent their recurrence in future. However, if discrepancies are the result of unavoidable causes such as inherent shrinkage or evaporation, receipts and issues in different units, climatic conditions, etc., passing of necessary adjustment entries will be adequate.
Inventory Tags:
These are the slips used in physical verification of stock. The inventory tag has two portions (see Figure 2.8). The upper portion is attached to the stores bin whose stock has been verified. Any bin that does not contain an inventory tag indicates that the item in that bin is still to be verified. The lower portion of the tag is torn off and kept together to serve the purpose of records of stock verification.
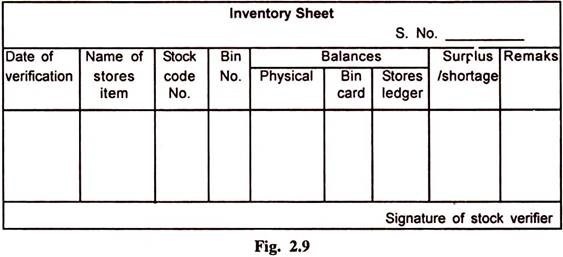
Inventory Sheet:
This sheet is prepared to record the result of stock verification (see Figure 2.9). It is also called stock verification sheet. All these sheets are maintained date-wise to provide a record of stock verification in a chronological order. The actual quantity of each stores item found at the time of physical stock verification is recorded in the appropriate column in the inventory sheet. Side by side the balance as per bin card/stores ledger is also entered.
After the completion of stock verification work, inventory sheets are sent to storekeeper/stores ledger clerk for making necessary entries so that the balances shown by stores records tally with the actual quantity in the bins. On the basis of this record necessary investigation is also conducted to ascertain the causes of discrepancy if any, and also to introduce remedial measures to avoid such recurrence in future.
Methods of Inventory Control – 8 Important Techniques: Stock Levels, Economic Order Quantity or Re-Order Quantity, ABC Analysis and a Few Others
Various techniques of inventory control are as follows:
1. Stock levels
2. Economic Order quantity or Re-order quantity
3. ABC Analysis
4. VED analysis
5. Just in time
Technique # 1. Stock Levels:
One of the major objectives of a system of material control is to ensure that there is no overstocking or under stocking. A scientific approach is to achieve this objective is to adopt a system of stock levels. The cost of inventory constitutes about 10% to 20% of the total cost of a product. Therefore it is necessary to have an effective inventory planning system to control the materials in the stores.
On the basis of stock levels each item of material will automatically be held within appropriate limits of control. The stock levels are for the purpose of to know when the order has to be made for replacement of stock.
The following are the various stock levels which are not fixed but changed from time to time:
(i) Re-Order Level:
It is just above the minimum stock level but below the maximum stock level. It is the point at which the store-keeper should initiate purchase requisition for fresh supply of materials. This level lies between minimum level and maximum level.
The following factors are to be considered while fixing this level:
(a) Rate of consumption of materials.
(b) Lead time or delivery period i.e. the length of time required from the date of order to the date of procurement of materials.
(c) Minimum level.
Re-order level is calculated as follows:
Re-order Level = Maximum consumption x Maximum Re-order period
(ii) Minimum Stock Level:
It is that level below which the stock should not normally be allowed to fall. In case any item of material falls below this level, there is a danger of stoppage of production and top priority should be given to purchase of new materials. It is also called safety stock or buffer stock.
The following factors are to be considered while fixing this level:
(a) Lead time
(b) Rate of consumption of materials
(c) Re-order level
Minimum Level is calculated as follows:
(iii) Maximum Stock Level:
It that level above which the stock of materials should not normally be allowed to raise.
The following factors are to be considered while fixing this level:
(a) Storage space available
(b) Lead time
(c) Working capital available
(d) Nature of materials
(e) Inventory carrying cost
(f) Market trends
(g) Government policies
(h) Economic order quantity
Maximum stock level is calculated as follows:
Maximum Stock Level = Re-order level + Re-order Quantity (or EOQ) – (Minimum Consumption x Minimum Re-order period)
(iv) Average Stock Level:
It is only the average of the stock which is available at the beginning and at the end. The average concept is useful in calculating stock turnover ratio, EOQ etc.
This stock level is calculated as follows:
(v) Danger Level:
When stock level falls below the minimum stock level is called as danger level. It is that level of materials which signifies the urgent need to buy the materials at the earliest possible time irrespective of cost of materials. It is warning signal for urgent action.
This level is calculated as follows:
Danger level = Average consumption x Earliest possible time for delivery
(a) Calculate always first re-order level and thereafter other levels.
(b) Final answers in stock levels are expressed in units or in any other form of quantitative terms.
Technique # 2. Economic Order Quantity:
It is also called as Reorder order quantity. It refers to the quantity to be ordered and materials are to be purchased at a reasonable price. By setting this quantity the buyer is saved the task of recalculating how much he should buy each time he orders.
Reorder Quantity is to be considered on the basis of purchasing the materials at a minimum cost.
It is to be considered on the basis of storage cost and ordering cost economic order quantity and is calculated as follows:
![]()
A = Annual consumptions of materials
B = Buying cost per order
C = Cost per unit of material
S = Storage and carrying cost percentage
No. of order in a year is calculated as follows:
![]()
Technique # 3. ABC Analysis:
It is a technique of value based system of material control. This technique is also called Always Better Control. Under this all items are classified according to their value.
ABC technique denotes ‘A’ items- It refers to high value of items OR high priced materials and a small or less quantity of items. Strict control is to be exercised by the management on such items. In this type the value of materials is 70% and quantity of materials is 10%.
‘B’ items- It refers to medium value of materials which are under normal control procedures and moderate control is to be exercised by the management on such items. In this type the value of materials is 25% and quantity of materials is 30%.
‘C’ items- It refers to low value of materials which may represents huge quantity of materials and management has to focus a least attention on such items. In this type the value of materials is 5% and the quantity of materials is 60%.
The purpose of classifying stock of materials as A,B & C is to ensure that material management focuses more attention on ‘ A’ items and greater degree of care should be taken in storing ‘B’ items may be given less attention and ‘C’ items least attention.
Technique # 4. VED Analysis:
It is the technique of segregating the parts in the stores according to their need and importance to the production activities and not the value. This technique is specially used for spare parts. According to VED analysis technique spare parts are divided in to three categories. They are- V=Vital, E=Essential and D= Desirable.
Vital Spare Parts are not expensive but they are important and without it there is a possibility of stoppage of production or production may not continue due to critical situation. Therefore the value of such spare parts cannot be measured in terms of money. For example- Bolts and nuts which are used for the machine, usage of gaskets and valves etc.
Essential Spare Parts are those which are not very important but essential and without it production may continue for a shorter period. For example- Chain, covers, grease etc. and little delay in supply does not affect the production.
Desirable spare parts are those which are needed but the cost of shortage of these parts are negligible and hence a reasonable delay does not damage the situation. For example accessories in automobile such as brake light, rear view mirror, seat cover etc. are desirable but not very important. The limitation of ABC analysis is categorising is not done on the basis of importance of materials but it is based on the concept of materials. VED analysis is suitable in a crisis production planning.
Technique # 5. Just in Time (JIT):
It refers to proper planning is to be done for getting the materials well in time for the production. The purpose of JIT is to reduce stock levels to the minimum and keeping continuous relationship with the suppliers and supplying raw materials frequently in small quantities based on the requirement according to the present market price. It helps in reducing storage cost, material handling cost, spoilages or breakages, deterioration in quality, weight loss etc.
Methods of Inventory Control – 6 Main Techniques: ABC Analysis, VED Analysis, FNSD Analysis, SDE Analysis, SOS Analysis and HML Analysis
Technique # 1. ABC Analysis:
ABC analysis, popularly known as Always Better -Control, was developed by an Italian economist, Vilfredo Pareto. This technique is based on ‘Management by Exception’ principle, and it is also known as Control by Importance and Exception or Proportional Value Analysis.
The analysis is based on comparative study of the quantity and consumption value of different types of materials. It is a general observation that out of the various materials handled by a firm, there are some items which account for low quantity and high value, and some items account for large quantity and low value.
Category A – Items are of low quantity with high value.
Category B – Items are of medium quantity and value.
Category C – Items are of high quantity with small value.
The exact quantification of high/low classification depends on comparative value and differs from firm to firm and also from time to time.
It is the technique which follows the general principle of ‘Pareto (80/20) distribution’. It states that to control a series of material items, a selected small fraction of number of elements would always account for a large proportion of consumption value.
For example, 80% of a nation’s wealth is held by 20% of its population and so the remaining 80% of the population hold only 20% of its net wealth. Therefore, to attain maximum benefit, these 20% of the entire population should be monitored and controlled closely.
ABC analysis classifies the whole stock into three categories according to their consumption value.
The technique requires that:
i. ‘A’ group items should be closely controlled at all stages of material handling. The procedure should be elaborate and subject to surprise verification by top management.
ii. ‘B’ group items also need elaborate control, but the extent and frequency of surprise verification may be less.
iii. ‘C’ group items, in view of their comparative low value, are not subjected to detailed control procedures. The procedure may be simple.
In this process, the time, attention, and cost involved in material control is divided equitably in terms of value. In the times of changing prices, the analysis of materials in A, B, C groups should be reviewed continuously. The technique is aimed at obtaining maximum control over stocks/ material with minimum cost of control.
(a) Minimum investment – ABC analysis ensures that a minimum investment will be made in stocks, so that the danger of interruptions in production due to unavailability of material can be kept at bay.
(b) The cost of placing an order is minimized if supported by economic order quantity.
(c) It ensures strict control on costly items in which a large amount of capital is tied up.
(d) It helps to maintain a high stock turnover rate.
(e) Management time is saved, since attention is paid on selected items.
(f) Obsolete stock can be easily pinpointed.
Disadvantages of ABC Analysis:
(a) It should be introduced with standardization and codification to get better results.
(b) The gradation of various items in ABC analysis may include a lot of subjective elements or parameters.
(c) The results of ABC analysis should be reviewed regularly and updated.
Technique # 2. VED Analysis:
Vital, Essential, and Desirable (VED) analysis is based on criticality of raw materials. According to this analysis, items are divided into three categories in descending order.
The stock of vital items requires more action; because without it, the production is held up. The items that come under ‘V’ should be stored adequately for smooth production. V class items are vital for smooth functioning of the production system. In the absence of such items, the plant and machinery would stop running and production would come to a halt.
Essential items are necessary for efficient running of production; and without it, the production will be held up; but a reasonable care is taken for E items to ensure they are always in stock.
Desirable items are useful to increase efficiency, and non-availability of these items do not affect the production immediately. D class items do not have an immediate effect upon the production. However, their availability reduces tiredness and enhances the efficiency.
VED analysis can be very useful to capital-intensive process industries. As it analyses the items based on their criticality, it can be used for those special raw material which are difficult to procure.
Strict control must be exercised over V items. Proper analysis must be conducted, adequate stocks must be maintained and a good network of reliable supplier must be created.
A modified form of this technique is termed as VEIN (Vital, Essential, Importance, and Normal) which is used to control the plant and machineries. When this technique is used in conjunction with VED analysis, it becomes one of the effective techniques of material control.
Under this technique, vital spares are arranged for all types of plants—vital, essential, important, and normal. Similarly, essential spares are arranged for all the four categories of machines.
Technique # 3. FNSD Analysis:
Under FNSD analysis, items are divided into four categories on the basis of their usage rate in descending order:
F = Fast moving items
N = Normal moving items
S = Slow moving items
D = Dead stock.
Fast moving items are consumed regularly, and the stock of these items must be observed constantly, and replenishment order be placed in time to avoid stock-out situations. Fast moving materials are consumed very frequently in the production process, and hence they are to be replenished at frequent intervals.
In other words, the stock velocities of such items are high. These items should be controlled tightly. Proper monitoring, timely placement of replenishment orders and regular follow-up are necessary in order to ensure that no stock outs take place.
Normal moving items are exhausted over a period of year or so. Slow moving items are existing stock which would last for two years or more at the current rate of usage, but it is still expected to be used up; and its stock must be reviewed very carefully before replenishment of order to minimize the risk of a surplus stock.
Slow moving material, on the other hand, is consumed less frequently. In other words, it has low turnover rate.
Dead stock is the existing stock for which no demand can be foreseen. The money spent on dead stock cannot be realized, but it occupies space. Efforts are made to find alternative use of ‘D’ items, otherwise they are disposed.
There is another category of items which are termed as non-moving items. These are the materials which are not required for the current production, but these stocks would be sought after in the near future.
A careful watch is to be kept on all these three category of materials, so as to keep further stock of slow moving and dormant stock to minimum while increasing the stock of fast moving materials.
Technique # 4. SDE Analysis:
This technique is used to exercise control over materials depending upon their ready availability.
S = Scarce items
D = Difficult items
E = Easy items.
Any item of material which is scarce in suppliers is to be stoked in excess quantities irrespective of its value, volume, and frequency of its movement in the production process. So, constant efforts are to be made to procure difficult-to-obtain type of material. But, no extra efforts are required in case of easy-to-obtain type of material.
Technique # 5. SOS Analysis:
S = Seasonal materials
OS = Off-seasonal materials
Under this technique of material control, materials are classified into two types. However, it is the seasonal materials which are given more important in terms of procurements.
Technique # 6. HML Analysis:
H = High-cost items
M = Medium-cost items
L = Low-cost items
As compared to ABC Analysis, which takes into account the consumption value of material, this analysis considers unit value of stores items. The material would be given more importance and tight control having high unit of value. The M items with a moderate unit value will be given low degree of control, and L items will receive least degree of control.